Quantum Titan MT5 (Signal 2362973): Reverse Analysis of Trading Logic
Quantum Titan MT5 · Gold Momentum Breakout · Sub-second Scalping
Sources: 108 closed trades from the MQL5 signal page (2026-03-10 to 2026-09-11, XAUUSD+, EUR account, live Vantage account), cross-checked against local MT5 XAUUSD M5/H1 history with 100% timestamp alignment, product-page information, and public signal statistics. Analysis scripts: titan_csv_stats.py / titan_stage2.py / titan_stage3.py.
1. Executive Conclusion
Quantum Titan is a gold momentum-breakout, sub-second scalping system. It monitors XAUUSD and waits for price to surge by more than $4 within five minutes, break the high or low of the previous 30 minutes to four hours, and align with the H1 trend. It then chases the move at tick level. A fixed $10 stop-loss, reduced to $5 from September 2026, defines risk, while a dynamic small take-profit of roughly $1.5 to $3, a tight trailing mechanism, and a momentum-stagnation exit capture the final stage of the impulse within seconds or minutes. The 88% win rate offsets a 1:4.7 reward-to-risk ratio. Position size equals risk amount divided by stop distance, with the risk tier of 2% / 3% / 5% / 10% adjusting automatically to drawdown conditions. There is no grid, martingale, or loss averaging, and only one position is normally held at a time.
2. Evidence Chain
2.1 Entry: Momentum Breakout, Not Pullback Buying
- Five-minute price displacement before entry, in trade direction: 100% positive, with a median of +$9.5; 76% exceeded $6, and the maximum was $48.
- Entry price relative to the previous 30-minute high/low: 96% had already broken the extreme, with a median extension of $3.8. A total of 84-86% also exceeded the previous four-hour extreme.
- M5 context: 100% of prices were on the correct side of EMA20/EMA50, CCI had the matching sign, and +DI exceeded -DI. Median M5 RSI at entry was 73 for longs and 29 for shorts. The system follows strength rather than reversals.
- H1 trend filter: 96% of long trades were above H1 EMA20/EMA50, with shorts mirrored below. Entries therefore aligned with the hourly trend.
- Entries occurred while an M5 candle was still forming, on average 133 seconds into the bar, with only 2.8% at the open. This indicates tick-level triggering rather than bar-close confirmation.
2.2 Exit: Fixed Stop-Loss with Dynamic Sub-second Profit Taking
- The stop-loss is a hard constraint. Eight of the 13 losing trades closed at exactly -$10.00 from March through August, while five closed between -$4.25 and -$5.44 from September onward. The stop is a fixed price distance that was later halved.
- Take-profit is not fixed. The 95 winning trades show a continuous displacement range of $0.5 to $14.2, with a median of $1.75 and no fixed-TP spike. This points to dynamic target or trailing exits.
- All 56 trades held for five seconds or less were profitable, with a median of +$2.0. Win rate and displacement deteriorate as holding time increases, indicating that the system harvests continuation and exits when momentum fades.
- A small number of trades remained open for tens of minutes, with the longest at 88 minutes, yet earned only $1 to $3. There is no strict time stop; trades are closed by profit conditions or the stop-loss.
2.3 Position Size and Risk: Discrete Tiers Linked to Drawdown
Recovery mode ~10%, triggered at 9.8% drawdownFrom 2026.09: SL halved to $5; risk reduced to ~2%
| Period | Risk Tier | Lot Profile | Account State |
|---|---|---|---|
| 2026-03-10 → 2026-05-26 | ~5% | 2.9-3.4 | Steady account growth |
| 2026-05-29 → 2026-06-19 | ~10% recovery mode | 6.0-7.6 | Triggered after three consecutive May losses and a 9.8% drawdown; June net profit +15,098 |
| 2026-06-22 → 2026-07-24 | Reduced to ~5% | 3.9-4.8 lots, gradually increasing with balance | Risk tier reduced after equity reached a new high |
| 2026-07-28 → 2026-08-28 | Fixed amount ~$3,000, approximately 3% | Constant 3.00 lots | Consecutive new highs; profits locked in |
| 2026-09-01 → 2026-09-11 | ~2%, with SL halved from $10 to $5 | 3.0-4.0 | Risk reduced after consecutive September losses, monthly result -4,139 |
The conversion remained consistent: lots = risk amount / (stop price distance × 100oz contract). For example, EUR 50,000 × 5% is approximately $2,900; $2,900 / $10 equals 2.9 lots. This matches the product page's claim of eight automatic risk levels with maximum drawdown protection: deeper drawdown triggers a higher recovery tier, new equity highs reduce risk, and extreme drawdown triggers a circuit breaker or halved risk.
2.4 All 13 Losing Trades
| Time (server) | Direction | Lots | Displacement | Holding | P/L EUR | Fixed SL Hit |
|---|---|---|---|---|---|---|
| 2026-03-25 01:05 | Buy | 3.08 | -10.00 | 1216s | -2,654 | Yes |
| 2026-04-09 03:07 | Sell | 3.32 | -10.00 | 870s | -2,848 | Yes |
| 2026-04-28 05:00 | Sell | 3.29 | -10.00 | 718s | -2,809 | Yes |
| 2026-05-14 07:00 | Sell | 3.37 | -10.00 | 487s | -2,877 | Yes |
| 2026-05-21 03:15 | Buy | 3.27 | -10.00 | 181s | -2,813 | Yes |
| 2026-05-26 02:18 | Buy | 3.11 | -10.00 | 539s | -2,672 | Yes |
| 2026-07-29 21:00 | Buy | 3.00 | -10.00 | 6s | -2,629 | Yes |
| 2026-08-04 14:52 | Buy | 3.00 | -10.00 | 207s | -2,605 | Yes |
| 2026-09-03 03:59 | Buy | 3.00 | -5.02 | 15s | -1,300 | Yes ($5 tier) |
| 2026-09-08 19:09 | Sell | 4.00 | -5.14 | 246s | -1,769 | Yes ($5 tier) |
| 2026-09-09 03:06 | Sell | 4.00 | -5.44 | 254s | -1,871 | Yes ($5 tier) |
| 2026-09-10 09:00 | Buy | 4.00 | -5.39 | 7s | -1,852 | Yes ($5 tier) |
| 2026-09-11 01:41 | Sell | 4.00 | -4.25 | 624s | -1,464 | Yes ($5 tier) |
The momentum profile at entry was not materially different between losing and winning trades: median five-minute displacement was $7.8 versus $9.7. Losses came from impulse reversals and represent the strategy's inherent cost rather than a separate entry logic. Trades stopped within 6 to 15 seconds were all caused by violent reversals, such as 2026-07-29 21:00 and 2026-09-10 09:00.
3. Complete Trading Logic Blueprint
| Module | Inferred Rule | Confidence |
|---|---|---|
| Symbol / Timeframes | XAUUSD only. The EA can be attached to any chart period, but uses M5 internally for triggers, ATR, and ADX; H1 for trend filtering; and tick data for entry execution. | 5/5 |
| Entry Direction | Symmetric long and short logic: price surges through a recent extreme and remains aligned with the H1 trend. | 5/5 |
| Trigger | Breakout of the last six M5 bars, or 30 minutes, plus an approximately $0.30 buffer; five-minute displacement of at least $4 to $6; ADX above 20. | 4/5 |
| Execution | Market entry at tick level, normally one position at a time. Only two simultaneous trade pairs occurred across 108 trades. | 5/5 |
| Stop-Loss | Fixed price distance of $10, or 1,000 points. Reduced to $5, or 500 points, from 2026-09-01. | 5/5 |
| Take-Profit / Exit | Dynamic target of approximately 0.3 to 0.4 times M5 ATR(14), roughly $1.5 to $3, combined with a tight trail of about $0.8 and a stagnation exit after N seconds without a new extreme. | 3/5 |
| Position Size | Lots = risk amount / (SL price distance × 100). Risk tiers of 2%, 3%, 5%, and 10% adjust with drawdown. A fixed $3,000 risk mode was also observed. | 4/5 |
| Risk Controls | Equity drawdown circuit breaker; spread filtering, requiring a RAW/ECN account; VPS required because second-level opportunities cannot tolerate disconnection. | 4/5 |
| Not Used | No grid, no martingale, no averaging down, and no overnight swap exposure because holding periods are extremely short. | 5/5 |
4. Replication Notes and Risk Warnings
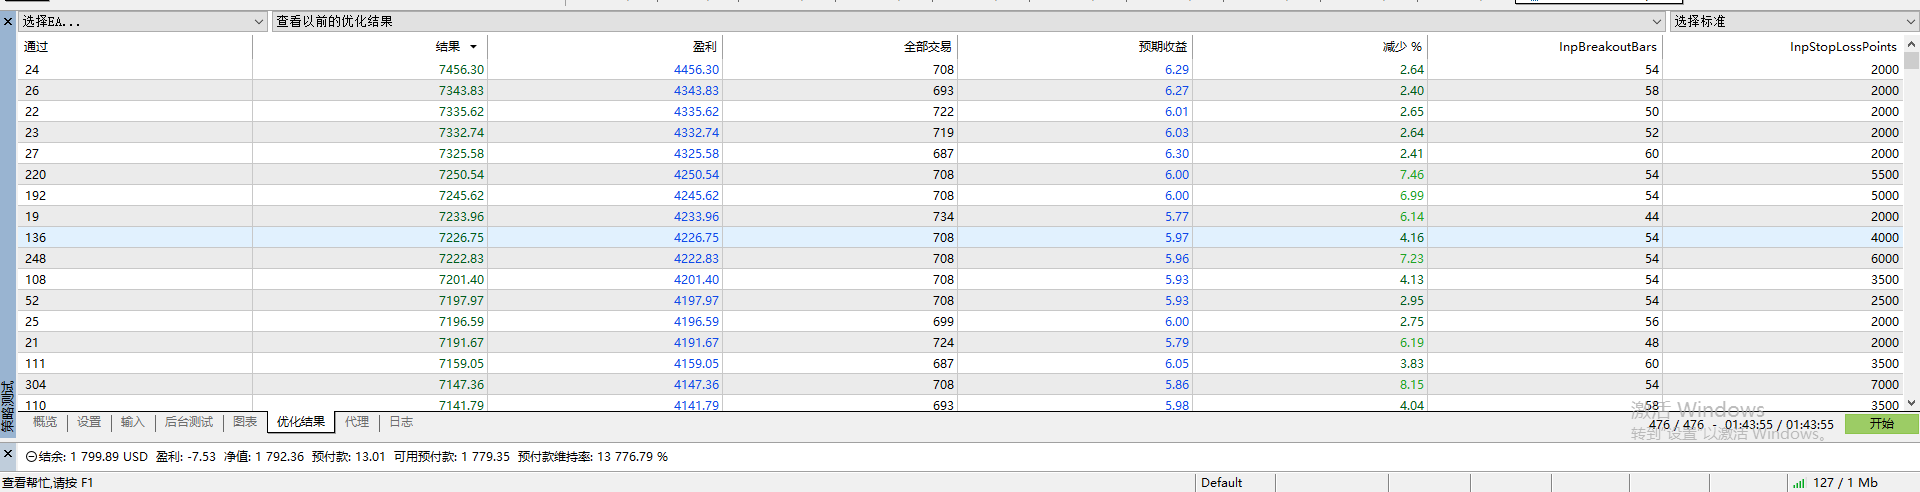
Experts/QuantumTitanReplica/QuantumTitanReplica.mq5 implements the full framework described above: breakout and momentum triggers, H1/M5 trend filters, fixed stop-loss, dynamic ATR take-profit, trailing stop, stagnation and timeout exits, drawdown-adaptive risk tiers, and circuit breaker. All parameters are configurable for XAUUSD M5 backtesting and optimization.- The payoff structure is the opposite of an antifragile design. The average loss of EUR -2,320 is about 3.1 times the average profit of EUR 753. If the win rate falls from 88% to below roughly 74%, the strategy turns unprofitable. Five losing trades and a drawdown appeared in September, prompting the author to halve risk. Preserve this risk-control linkage in any replication.
- Profits are highly concentrated. The signal page warns that 80% of growth came from two days. Most profit was generated by extreme one-way gold moves from 4,500 to 4,000 and back to 4,600 in June and July. Returns in calm markets will be substantially lower.
- Execution quality is part of the strategy. Second-level holding periods mean that spread, slippage, and latency directly consume the edge. The signal page also warns of substantial negative slippage when copying trades. RAW/ECN execution and a VPS are required, and a broker change requires renewed validation.
- Continued profitability depends on gold maintaining a high frequency of sharp impulses. The volatile 2026 range of roughly $4,000 to $4,800 provided ideal conditions. Backtests should include different volatility regimes such as 2024 and 2025.
Equity Curve
Red area below = drawdown %, 0-16% Risk raised to 10% Reduced to 5% Reduced to 3% Reduced to 2% + SL halved